
Homes on the Range: Emerging Policies to Expand the Supply of Homes
Last in a Series on Housing Demand, Underproduction, and a Call for Action to Meet Housing Needs in the West to 2030
by Arthur C. Nelson, Ph.D., FAICP
May you live in interesting times
Oft cited as the English translation of a Chinese curse wishing one’s life to be filled with turbulence and instability, this phrase was part of a speech offered by Englishman Joseph Chamberlain in 1898 with entirely different intentions:
I think that you will all agree that we are living in most interesting times. I never remember myself a time in which our history was so full, in which day by day brought us new objects of interest, and, let me say also, new objects for anxiety. 1
The more nuanced meaning of the term thus relates to changes both pleasant and challenging, not unlike modern characterizations of disruption and disruptive events where we can have both positive and challenging outcomes. This is the world of land use policy relating to housing in which we planners find ourselves.
In this closing article to the six-part series, Homes on the Range, I focus on emerging policies in selected western states and their implications for planners, public officials, developers, and engaged citizens in the West. The article is comprised of these sections:
Housing underproduction nationally and among the western states;
Missing households in the West;
The framework for local land use and development planning;
The emerging role of land-use planning, state preemptions, and financial inducements to expand housing choice and supply in the selected states of California, Utah, Montana, Colorado, and Oregon; and
Detailed case study of how Oregon has used 50 years of state guidance in directing local governments to expand housing supply and choice.
In prior articles, I assessed missing households in four regions (see Figure 1):
Southern Tier comprised of the states of Arizona, Colorado, New Mexico, Nevada, and Utah in Homes on the Range: Closing the Southern Tier Household Gap;
Northern Tier comprised of the states of Idaho, Montana, North and South Dakota, and Wyoming in Homes on the Range: Northern Tier’s Missing Households;
Northwest states comprised of Alaska, Oregon, and Washington states in Homes on the Range: Northwests Missing Households
California in Homes on the Range: California’s Missing Households

Figure 1. States used for the Western Planner Series, Homes on the Range
Source: Map created with https://www.mapchart.net/usa.html
Housing Underproduction Nationally and in the West
In this section I review national “housing underproduction” for the nation and the western states and offer some reasons for this.
Housing Underproduction Nationally
Various estimates put the shortfall of housing in America at between about 3.8 million (2) in terms of total unmet housing needs and 7.3 million homes in terms of affordable rental housing units (3). Up for Growth, a DC think-tank (4), shows that the housing shortfall has been increasing since 2012, as shown in Table 1.
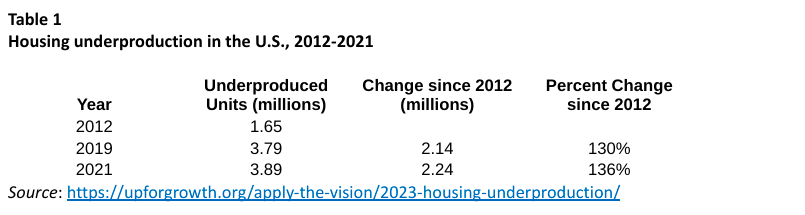
Housing underproduction is an estimate of missing households plus adjustments for uninhabitable, seasonal, and vacant homes. (5) In 2012, the first year after the housing market achieved stabilization from the Great Recession of 2007-09, the nation was 1.65 million housing units short of meeting housing needs. That figure more than doubled to 3.89 million units (136%) by 2021. Indeed, despite record low pandemic-induced mortgage rates from middle 2020 through 2021, housing underproduction increased between 2019 (before the pandemic) through 2021. Metropolitan areas where housing was underproduced relative to demand increased by 14% between 2019-2021, again despite record low mortgage rates during most of that period. (6)
Housing Underproduction in the West
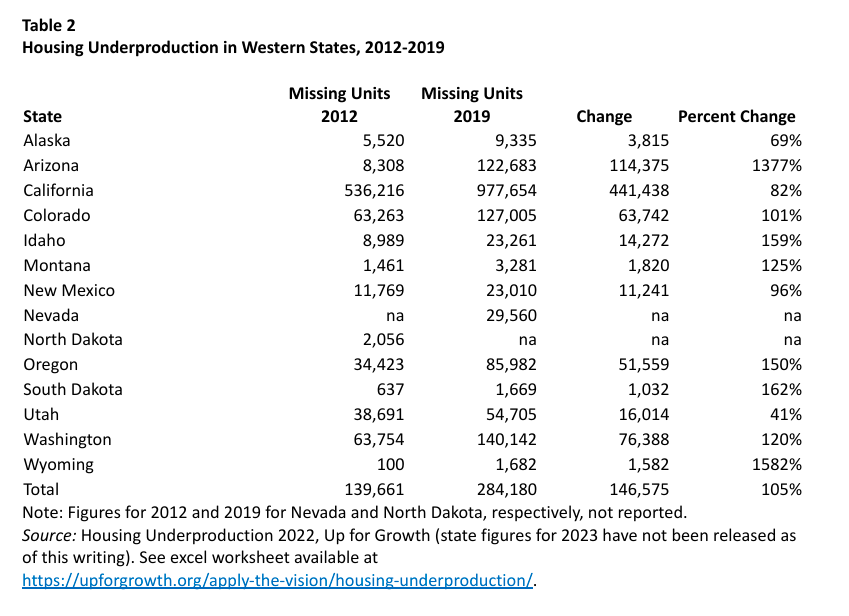
Table 2 uses Up for Growth’s housing underproduction analysis to show the shortfall in housing units in the West for 2012 and 2019 (figures for 2021 have not been released). Notably, however, underproduction in the west occurred at a slower pace than the nation, 105% compared to 130%. On the other hand, housing underproduction occurred at a faster pace than the nation in the states of Arizona, Idaho, Oregon, South Dakota, and Wyoming.
Missing Households in the West
A chief limitation of Up for Growth’s housing underproduction methodology is that it does not apply to census-defined metropolitan areas. My methodology published in The Western Planner includes metropolitan areas of more than 65,000 persons which is the census threshold for its 1-year American Community Survey (ACS) sample. Future work will include all metropolitan areas.
Moreover, although Up for Growth calculates missing households, it does so based on householders younger than 45 years of age and older—just two categories. In my series for The Western Planner, I estimate missing households based on headship rates (7) between 15 to 34, 35 to 44, 45 to 54, 55 to 64, and 65 years of age or older from the 2000 Census applied to the 2021 ACS. (8)
Finally, one can also quibble with Up for Growth’s adjustments based on habitable units, as well as seasonal and vacancy rates, and using a 5% vacancy rate for all detached and attached units. My approach is simple to estimate total demand for occupied housing units by state and metropolitan area. Local experts can adjust my estimates to account for uninhabitable units, seasonal use, and vacancy rates.
Table 3 summarizes my analysis for missing households in the West. This figure is included in the total occupied housing units needed in 2030. For regions analyzed in The Western Planner series, more than 364,000 new occupied housing units will need to be added to the inventory to house all households between 2021 and 2030. Although large, it is not unattainable for reasons noted at the end.

The Framework for Local Land Use and Development Planning
This part outlines the context of land use decision making among the western states and then summarizes how selected states are using or changing the local land use decision making process to help achieve broad statewide aims. It forms the basis for reviewing how specific states are recasting land use and development laws to advance housing production.
The Context of Land Use Decisions in the West
Local land use power emanates from state constitutions and legislatures while development decisions emanate through due process constraints. These twin pillars of local land use decision making are reviewed here.
State-Conferred Powers
Local governments are conferred powers to engage in land use planning and development decision making through Home Rule or Dillon’s Rule authority. In states without express constitutional powers granted to local governments, “Dillon’s Rule” (9) limits a local government’s power to those granted expressly by the legislature. In contrast, “Home Rule” is a delegation of power from the state to local governments often through state constitutional provisions or through a special grant of powers, often through a charter. Figure 2 shows the distribution of Dillon and Home Rule states nationally, along with hybrids such as Home Rule conferred through charter by Dillion’s Rule states.
In all, 39 states are characterized as Dillon’s Rule states including seven in the west (Arizona, Idaho, Nevada, North and South Dakota, Washington, and Wyoming), five are characterized as Home Rule states (Alaska, Colorado, Montana. New Mexico, and Utah), and two are hybrids as Home Rule is conferred only to charter cities (California and Colorado).
But does Home Rule or Dillon’s Rule really make a difference? For instance, the Home Rule state of Oregon has preempted local land use and development decision making while the Home Rule state of Montana has preempted local residential zoning. The hybrid state of California has preempted charter cities from residential land use zoning and development decision-making while Arizona and Washington have conferred considerable land use and development regulation powers to local governments. As a practical matter, there is not much difference between Home Rule and Dillion’s Rule states because ultimately the state legislatures confer or rescind powers and otherwise frame how local decisions are made. (10)

Figure 2. Home Rule and Dillon’s Rule states
Source: Richardson, Jr., Gough, and Puentes (2003).
Due Process Decision-Making
Regardless of the Home Rule or Dillon’s Rule framework, local land use and development decisions are based on due process through legislative, quasi-judicial, and ministerial (administrative) procedures. (11) Legislative decisions are often high-level where broad policy is made such as what open spaces should be protected and where homes should be built. They can also be specific such as establishing specific land use and design parameters for individual parcels in master planned communities, special area plans, and so forth. Legislative decisions carry the highest level of judicial deference through the “presumption of validity” or “fairly debatable” doctrine. (12) At the other end of the spectrum are ministerial or administrative decisions such as issuing building permits that are consistent with building and development codes. The messy part of planning is usually in the middle during quasi-judicial processes. For instance, virtually all the US Supreme Court’s land use-related rulings over the past half century have been over local quasi-judicial decisions often dealing with conditions of development approval. Quasi-judicial decisions affecting zone changes, subdivisions, small scale zone changes and plan amendments are the bread-and-butter of NIMBY (not-in-my-backyard) activism. It is also this middle ground of local land use and development decisions that is attracting legislative preemption. For example, Arizona has legislation that converts all quasi-judicial land use decisions (even down to conditional uses and variances) into legislative ones, thereby constraining the ability of NIMBYs to overcome the “presumption of validity” or “fairly debatable” legislative doctrine. I will address how some states are curtailing quasi-judicial processes below.
Land Use Planning Focus on Housing in California, Oregon, Utah, Montana, and Colorado
Five states are the focus of this section with respect to legislation that has preempted local land use and development decisions, reigned in NIMBYism, and used carrots and sticks to induce local governments to broaden housing choices and expand housing supply. I start with California as the nation’s preeminent exemplar of seemingly out-of-control NIMBYism. I continue with Utah which combines preemption with carrots-and-sticks to advance accessory dwelling units (ADUs) and moderate-income housing. Montana is highlighted for its recent preemption efforts that also use carrots-and-sticks. Colorado, which eschews preemptions in favor of a novel carrots-and-sticks approach, is then reviewed. I conclude this section with a summary of Oregon’s recent efforts to expand housing choice and supply. This is followed by a section that offers an in-depth review of Oregon’s success in doing so with lessons for states in the west and elsewhere.
California
In many ways, California is the poster child for using regulations to frustrate the production of housing. While it's an oversimplification, I believe that this is an outcome of two events that occurred in the 1970s. The first is the California Environmental Quality Act (CEQA) which soon morphed into a NIMBY bonanza soon after enactment, and Proposition 13 which starved local governments of revenue needed to pay their bills. After decades of being on the defensive, and after much social damage had been inflicted especially on lower-and middle-income households, California has turned a corner.
California Environmental Quality Act (CEQA)
Patterned after President Richard Nixon’s National Environmental Policy Act (NEPA) of 1969, Governor Ronald Reagan signed CEQA (pronounced see-qua) into law in 1970. Its purpose is to ensure that land use changes in the form of plan amendments, quasi-judicial review, and so forth, leading to new development would not harm local environments and communities, but if so, then mitigation would be calibrated to offset negative impacts. (13) As initially designed, local officials would conduct an initial study to determine which of up to 18 areas of impact assessment would be required in a formal impact analysis. However, NIMBYs were able to wrest control of this process by securing favorable court reviews that essentially required all projects and policies falling under CEQA’s purview to be assessed based on all 18 areas. (14) This added considerable cost and delay, which was the desired NIMBY outcome. (15) I offer this excerpt from Wikipedia characterizing the realities of the CEQA process: (16)
CEQA has been criticized for being abused (used for reasons other than environmental ones) to block, downsize, delay, or gain other concessions from new development. CEQA has even been used to block or delay projects that have positive environmental impacts, such as solar plants, wind turbines, bike lanes on pre-existing roads, and denser housing. One study found that 85% of CEQA lawsuits were filed by organizations with no record of environmental advocacy and 80% of CEQA lawsuits targeted infill development. CEQA has also been used by NIMBYs to block homeless shelters, student housing and affordable housing projects, by businesses to try to block competition, and by unions to force developers to use union workers. All governors since 1983 ... have stated that CEQA needs to be reformed.
Needless to say, reforms have not occurred. However, the legislature has intervened through preemption of local land use policies to advance housing choice and supply in ways outlined below.
Proposition 13
Proposition 13, which is also known as Jarvis-Gann but officially known as the People's Initiative to Limit Property Taxation, was adopted by 62% of California voters in 1978 as an amendment of the Constitution of California. The most significant portion of the act limits the property tax rate for real estate:
Section 1. (a) The maximum amount of any ad valorem tax on real property shall not exceed one percent (1%) of the full cash value of such property. The one percent (1%) tax to be collected by the counties and apportioned according to law to the districts within the counties.
It decreased property taxes retroactively by assessing property at its 1976 value and then restricted annual increases of assessed value to an inflation factor but not to exceed 2% per year. Proposition 13 applies to real estate.
A key outcome is that local governments across the state were disincentivized to approve all but the most expensive and lowest density housing projects as a hedge against being unable to provide basic public services—especially education—over time. To offset lost property tax revenues, California has become a national leader in crafting innovative user fees, impact fees, and concessions for long term public facility financing through development agreements that are also often triggered by CEQA. Because Proposition 13 does not apply to sales taxes, local governments compete to attract new sales tax-driven developments to their communities, often triggering lawsuits by nearby communities that also often lead to shared revenue agreements.
The combination of high growth rates, NIMBY activism fueled by CEQA, and Proposition 13 squeezed California’s ability to meet housing needs. Indeed, as I noted in the California installment to this series, California is “missing” 1.3 million households or nearly 10% of the total because there aren’t enough homes to house them.
Sea Change in California By-Right Housing Opportunities
Over the past decade, California lawmakers have attempted to expand housing choice and supply through various forms of preemption. This has led to more than 100 new laws addressing:
Accessory dwelling units;
Small-scale projects;
Allowing apartments in certain commercial zones;
Expanding the state’s density bonus laws;
Streamlining review of targeted residential projects; and
Enforcing California’s rigorous housing element requirements. (17)
For much of the state, ADUs are now by-right land uses in single-family residential zones as ministerial actions as opposed to quasi-judicial actions. This removes public engagement in issuing ADU permits. By 2023, the number of ADUs constructed had risen to thousands of units per month.
Duplexes are also allowed on individual lots through lot splits from the primary residence resulting in townhomes on individual lots or condominiums with shared land. The Terner Center estimated that this policy has the potential to create 700,000 new housing units statewide. (18)
Apartments are now allowed by right in certain commercial zones. Moreover, state preemptions now prohibit local governments from imposing parking mandates within a half-mile of qualifying transit stops. They also allow developers to override local zoning to build residential projects on land zoned for retail and offices.
California’s unique density bonus laws (DBLs) have been expanded to enable density-by-right bonuses where affordable units are in qualifying developments. The DBLs also mandate certain concessions and waivers including relaxing development standards. Furthermore, developments meeting state standards can receive a 50% density bonus where they dedicate 15% of the units to lower-income households. A related law provides that if 100% of the residential units are affordable, the density bonus increases to 80%, and there is an unlimited density bonus for affordable housing developments of up to three floors if located within a quarter mile of qualifying transit stops.
Preemption of local permitting is a fifth state effort. Like most states, California gives local governments considerable discretion in reviewing proposals for entitlement. Proposals can be denied even if they are in accordance with the local general plan and zoning standards. This occurs when projects are determined to be reviewable under CEQA, often resulting in conditions of approval aimed at mitigating development with two perverse outcomes: (a) if the conditions are too onerous, the project does not get built and some level of mitigation does not occur, and (b) projects that fall under the CEQA review threshold, but with equal or more impact, proceed without any mitigation. One effort to streamline the review process exempts qualifying affordable housing projects from CEQA review. That provision sets minimum thresholds for affordable units that vary based on the project size and jurisdiction.
The sixth effort is enforcing the state’s Housing Element Law which was passed in 1969. Every local general plan must have a Housing Element. In recent years, the Housing Element was required to comply with a Regional Housing Needs Assessment (RHNA) planning process, the result of which is regional coordination of efforts to meet local and regional housing needs. The only trouble is that regional housing needs were not met because too many local governments found ways to avoid implementing them. With apologies for glossing over many of the details of how the Housing Element and RHNA processes work, state laws now require consideration of housing cost burdens, overcrowding, and fair housing, and others to establish new housing production targets within discrete time periods. To make this effective, the state Attorney General’s office has been directed by the legislature to enforce these new laws. In theory, Housing Elements should no longer gather dust on local government shelves.
After decades of frustrated efforts to expand housing choice and supply in California, these would seem to be monumental efforts to meet the state’s housing needs. On balance, I am personally pleased that the ADU policy is working as well as it is. The effectiveness of other policies is not yet as clear.
The next three states, Utah, Montana, and Colorado, are reviewed briefly. Utah and Montana are “red” states where preemption of local land use laws is used to expand housing choice and supply. In some respects, red states are outdoing what the “blue” states of California and Oregon are doing. Colorado is a “purple” state where only carrots and sticks are used.
Utah
While California and Oregon have expanded housing options in single family residential districts considerably (reviewed in the fourth and fifth installments, respectively), neither goes as far as Utah in making accessory dwelling units (ADUs) by-right in a manner that supersedes covenants, conditions, and restrictions (CC&Rs) of title and homeowner association (HOA) approval (aka denial).
In 2021, the Republican-dominated Utah State Legislature passed HB 82 which requires cities and counties to allow ADUs as a permitted use in single family zoning districts if they are internal to the primary structures. Thus, the term “internal accessory dwelling unit” or “IADU” has become part of the planning and development lexicon in Utah. However, this law does not extend to mobile homes. Cities and counties have the option to restrict lot sizes to more than 6,000 square feet and add an additional parking pad to the lot. Cities also have the option to prohibit IADUs in up to 25% of the total area zoned for residential uses, or up to 67% if a university is in the city and has a student population of 10,000 or more. In 2023, responding to alleged abuses by some cities, the legislature exempted IADUs from impact fees.
Another landmark housing law is HB 364 of 2023 which amends the state’s “Moderate Income Housing Plan” (MIHP) mandate. All cities and counties of more than 5,000 residents must create plans to meet the housing needs of households with a gross household income of 80% or less of the county’s median gross income. Depending on various factors, MIHPs must include at least three to six strategies from among a list of 24 strategies. Not only must MIHPs be prepared but failure to prepare and implement them can lead to suspension of state transportation funds and eligibility for tax increment financing authority as well as daily fines.
A last key area of state preemption is the redelegation of subdivision approval authority from local governments to the state. This prohibits local governments from adding any more requirements than allowed by the state and (in theory) streamlines subdivision approval.
Montana
Fearful of “California style” increases in housing prices, Montana enacted a suite of laws in 2023 preempting local planning and also creating an incentive to receive low-interest infrastructure loans. In the five years from 2018 to 2023, the average home price in Montana nearly doubled from about $239,000 to $428,000, the second highest rate of increase in the nation, after Idaho. (19) By the time the legislature decided to preempt local control over many types of housing, about 70 percent of residentially zoned land in Montana’s 13 most populous cities prohibited multifamily homes. Prodded by Governor Greg Gianforte, bipartisan legislation led one of the nation’s most sweeping state-level efforts to expand housing choice and supply. Legislation included the measures outlined below.
In a playbook that could have come from Oregon (Knaap and Nelson 1993), through SB 382, the state legislature created the Montana Land Use Planning Act. It mandates planning for all cities of 5,000 persons or more (in counties of 70,000 or more persons). In terms of housing, the Act requires identifying and meeting housing needs over the next 20 years with 5-year assessments. Notably, the Act prohibits discretionary approvals for projects that are in conformance with the local comprehensive plans. Thus, projects that are consistent with the plan are approved ministerially, without hearings. In effect, NIMBYs’ only shot at undermining housing choice and production is during the process leading to adoption of the local comprehensive plan. This also elevates the stature of comprehensive plans because going forward they guide development decision-making. Plans will also have to be more detailed to ensure against vague provisions that can undermine the intent of plans to advance housing choice and production. Finally, in a playbook from Utah (see above), the Act requires adoption of at least five tools from a menu of 14. A related law, SB 407, limits design review relating to public health and safety, and variances are removed from quasi-judicial to staff-level administrative review.
SB 245 preempts local zoning by allowing multifamily and mixed-use buildings in existing commercially zoned districts by right in cities with more than 5,000 residents. Moreover, zoning in those cities cannot require more than one parking space per dwelling unit.
SB 528 might be the nation’s most permissive statewide accessory dwelling unit (ADU) law. It allows one ADU on every single-family home lot. In addition, cities cannot mandate off-street parking, owner occupancy requirements, or impact fees for ADUs. A related law, SB 323, legalizes attached or detached duplexes anywhere single family homes are allowed in cities with more than 5,000 residents.
To prevent local governments from increasing the cost of housing by adding to the state’s building code, SB 406 limits local building codes from being more stringent than the state.
Among other laws aimed at expanding housing choice and supply, HB 819 offers a financial carrot. It provides a $106 million revolving loan fund to help finance local infrastructure, provided the infrastructure improvement facilitates residential development of at least 10 units per acre. This is about the highest density feasible for detached homes and about the lowest density feasible for attached homes.
Colorado
In 2022, Colorado voters approved Initiative 123 by a 53-47% margin, thereby committing state income tax funds to be used for affordable housing. (20) Colorado is the only state with this kind of state level, taxpayer-driven approach. While mostly a big carrot in terms of funds, there is a stick. At full implementation during the 2020s, the initiative is expected to generate nearly $300 million annually to support various affordable housing programs. In all, the initiative is estimated to create about 170,000 affordable housing units over two decades. The stick is that local governments receiving state funds must increase their affordable housing supply by 3% annually by 2026. However, communities are not required to participate in the program. Its key features include:
Providing grants to local governments and loans to nonprofit organizations to develop affordable housing;
Creating an “affordable housing equity program” to leverage equity investments in multifamily rental housing units ensuring that rent does not exceed 30% of a household's income;
Creating a program to provide debt financing for low- and middle-income multi-family rental developments and existing affordable housing projects;
Creating an affordable home ownership program that provides down-payment assistance for qualifying homebuyers;
Creating a grant program for local governments to increase capacity to process development applications for housing projects; and
Creating a program to provide rental assistance, housing vouchers, case management and other services for homeless households.
Of the approximately $300 million in annual funding, 60% goes to the Office of Economic Development and International Trade (OEDIT) while 40% goes to the Department of Local Affairs (DOLA) through its Division of Housing (DOH).
OEDIT funds are managed by the Colorado Housing Finance Authority which runs programs in land banking, equity, and concessionary debt. Land bank funds must be used to acquire and preserve land for affordable for-sale housing or affordable rental housing. The equity program provides below-market-rate equity investments for the construction or preservation of low- and middle-income multifamily rental developments. The Concessionary Debt program provides loans for multifamily finance, federal low-income housing tax credit (LIHTC) gap financing, and LIHTC predevelopment financing.
With its 40% share, the DOH administers the Affordable Housing Support Fund. One purpose of this program is to increase the capacity of local government to advance affordable housing. This can be achieved through various means, such as hiring new staff and consultants, implementing new systems and technologies, revising land use plans and development codes, creating regional collaborations, and so forth.
Unlike the preemption approaches used in all other states reviewed above, Colorado’s approach is based on financial incentives, and is optional.
Oregon
Since 2019, Oregon has also led the nation in three other respects.
In 2019, the legislature adopted a mandatory “middle housing” statute that essentially eliminates single-family detached zoning statewide (with some exceptions) by allowing 2-, 3- and 4-plexes and townhomes by right. (21) Because the law took full effect only in 2022, it may be a few years before its effects can be measured.
In 2021, Oregon adopted a law that allows for affordable housing on land zoned for commercial or light industrial uses. In particular, it prohibits local governments from denying affordable housing proposals (with certain exceptions) for most types of nonresidential land. Housing built must serve households earning 80% or less below the area median income.
While these and related laws aim to expand the supply of housing, Oregon’s 2019 first-in-the-nation statewide rent regulation law may undermine part of this effort. The 2023 amendments to that law allow landlords to increase rent annually by 10%, or 7% above the applicable consumer price index, whichever is lower. The law is limited to structures that are 15 or more years old. One concern from a classic economic perspective is that investors with long-term perspectives may shy away from projects that are financially problematic at the margin, such as market rate lower income housing. On the other hand, the law could actually give landlords a rationale to increase rents by more than they would have otherwise. For instance, a common practice is for landlords to raise rents 3% annually or perhaps add an increment that is often lower than local inflation. Oregon’s law could induce those landlords to use state standards to raise rents by more than they would have otherwise. In any event, the law allows landlords to reset rents when units are rented to new tenants. In these respects, the law could have an inducive effect in expanding rental housing supply if landlords can use the law as their rationale to raise rents higher than they would have otherwise. The effect of this new policy on long-term rental housing production will not be known for many years.
I move next to a detailed case study of Oregon’s success in advancing housing choice and supply based on its unique commitment to doing so over the past half century, since 1973.
Oregon as a Case Study in Using Land-Use Planning to Expand Housing Supply and Choice
Oregon gets a bad rap for its assertive planning policies, especially how it advances housing choice and supply within urban growth boundaries (UGBs). Without knowing how Oregon’s statewide land use planning process works, knee-jerk economists proclaim Oregon’s planning fails to meet housing needs by raising prices, pushing down home ownership, and narrowing choice. I am compelled to use this opportunity in The Western Planner to (a) offer a summary of how that program works with special reference to housing, (b) present housing price and home ownership data showing how the state and its largest metropolitan area, Portland, compare to others, and (c) show how Oregon’s missing households figures for metropolitan areas are much lower than one would assume based on its bad rap.
Oregon’s Statewide Planning Program in a Nutshell
Oregon’s Senate Bill 100 was passed into law in 1973. I was a student intern on the committee that wrote it. After numerous amendments, court challenges, ballot measures, and such, the program boils down to these key elements (22) :
Prime farm and forest lands and other critical landscapes cannot be converted into urban uses;
Urban development is steered into areas designed to facilitate it within UGBs;
All housing needs must be identified and planned for over a 20-year period with periodic updates;
Sufficient land must be zoned within UGBs to meet development needs over the 20-year planning horizon;
Vague and confusing development review standards are replaced with clear and objective standards akin to a checklist; and
Time limits require decisions from the local level through the entire state court system, theoretically allowing for a final decision within one year of submission of a development proposal.
Knee-jerk economists allege that containing urban development within UGBs per se wreaks havoc on housing supply, prices, and choices. (23) This is not the case, as will be shown next.
Housing Outcomes
Astute economists know that markets differ because of their geographies, economies, and social and political structures. For instance, it is incorrect to equate the Dallas-Fort Worth "Metroplex" with its wide-open plains stretching hundreds of miles in all directions to southern California communities that are physically limited by an ocean, an international border, mountains, and extensive public land ownership. The nation is not one monolithic housing market as many simple-minded economists seem to assume, but is rather a mosaic of different markets shaped by the forces noted above, among many others. This was established long ago by Jesse M. Abraham, William N. Goetzmann, and Susan M. Wachter, (24, 25) who found the U.S. housing market clustered into the Northeast, the South excluding Texas, Texas, the Midwest, Los Angeles-San Francisco (LA-SF), and the rest of the West Coast. Housing economists who fail to recognize this may have their work questioned accordingly.
Given differences in housing market structures, I assess how metropolitan Portland—the state’s largest metropolitan area and the focus of much of SB 100’s concerns—compares to other major west coast metropolitan areas in terms of growth. In Table 3, we see that metropolitan Portland had the second fastest growth rate of any major west coast metro, 2010-2019 (before the COVID-19 pandemic), behind the Seattle metropolitan area. It also added more people than the larger metropolitan areas of Oakland, San Diego, San Francisco, and San Jose, which are part of the LA-SF cluster. So much for metropolitan Portland’s UGB stifling growth.

Next, consider housing prices. In Table 5, we see that metropolitan Portland’s housing prices are the second lowest among the largest west coast metros (only Riverside-San Bernardino-Ontario has lower prices) and housing prices increased at the third lowest rate (behind Los Angeles and Sacramento). So much for metropolitan Portland’s UGB raising housing prices relative to competitors in its market segment.

What about the income needed to buy homes? After all, housing prices are a false indicator of the ability of a household to own a home. Table 6 shows the percent of median household income needed to buy the median priced home among largest west coast metros as of March 2021. While Seattle fares just a touch better than Portland, both are the most affordable in terms of income to house price ratio.

We need to remind ourselves about what drives housing prices. The best predictor of housing demand is growth. For instance, Lonerock, which may be the smallest Oregon city with a UGB, may also have the state's most affordable housing stock because it has no growth. I call it the first "duh" principle in housing economics. The best predictor of housing prices is income: as income rises, the willingness and ability to buy a more expensive home increase. I call this the second "duh" principle in housing economics.
Which leads me to the biggest unresolved question in housing policy: Do we want cheap homes or homes of value? The best way to get cheap homes is to flood the market with housing. The best way to create valuable homes is to constrain supply so that prices rise even if it's beyond the reach of most households. Oregon aims for the middle between meeting market demand with supply in locations that are the most sensible from its policy perspectives but still by keeping the lid on price increases, at least to some extent.
Combining incomes and prices lead to what the National Association of Home Builders, along with Wells Fargo, call the Housing Opportunity Index (HOI), which is another way to look at housing affordability. It is defined as the share of homes sold in a metro that would have been affordable to a family earning the local median income, based on standard mortgage underwriting criteria (see the link in Table 6). Table 7 compares change in the HOI from 2012-2021 for the major west coast metropolitan areas. As seen by the negative numbers for the column labeled “Housing Opportunity Index Change 2012-2021”, all metropolitan areas lost ground. At the absolute bottom of the list of large metros is Portland-Vancouver-Hillsboro. Yes, it has become less affordable, but it has become less affordable at a slower pace than all other major West Coast metropolitan areas which together comprise the LA-SF and balance of West Coast housing markets based on Abraham, Goetzmann, and Wachter. Also notice that metropolitan Portland’s rate of housing price increases was 9th out of 11 while its change in income was 3rd out of 11. So much for metropolitan Portland’s UGB stifling housing affordability relative to its West Coast peers.

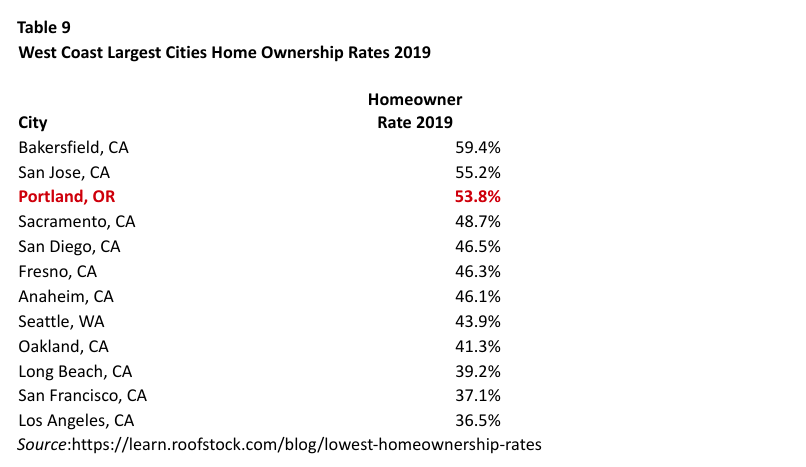
How does all this convert into home ownership rates? Home ownership rates for the eight largest West Coast metropolitan areas are shown in Table 8 and the 12 largest cities in Table 9. Table 8 shows that metropolitan Portland is tied for the second highest percent change in home ownership (behind Sacramento) while Table 9 shows the city of Portland had the third highest home ownership rate among the largest cities (behind Bakersfield and San Jose). So much for metropolitan Portland’s UGB stifling home ownership relative to its West Coast peers.

Considering the West Coast housing markets, one could conclude that despite Oregon’s planning—or more likely because of it—metropolitan Portland performs best overall in meeting housing demand based on objective metrics.
What about housing choices? A common charge leveled by libertarians is that Oregon’s planning restricts housing choices. To the extent that housing construction is steered away from resource areas to prevent negative externalities that undermine the productivity of resource lands (26) and to the extent that higher density housing occurs inside UGBs commensurate with market demand, these assertions are accurate. But the libertarian perspective seems to assume implicitly that all households want the same thing, being a large single-family home on a large lot away from things, perhaps free-and-clear and with unlimited incomes to maintain them. The housing market is not that simple-minded.
As I’ve shown through demographic analysis, (27) the supply of single-family homes on large lots exceeds demand by tens of millions. On the other hand, the demand for smaller homes on smaller lots and attached “middle housing” homes—defined as townhouses, duplexes, triplexes, fourplexes, and homes in low-rise, one- to three-floor structures (usually without elevators)—exceeds supply by tens of millions nationally. The reason is that stated-preference surveys by the National Association of Realtors (NAR) report that while slightly less than half of American households want larger homes on larger lots in only drivable communities, the majority want smaller homes on smaller lots or attached homes in walkable communities. (28) To what extent does Oregon meet the wider range of housing needs better than its West Coast neighbors? Table 10, based on census data, offers some insights.
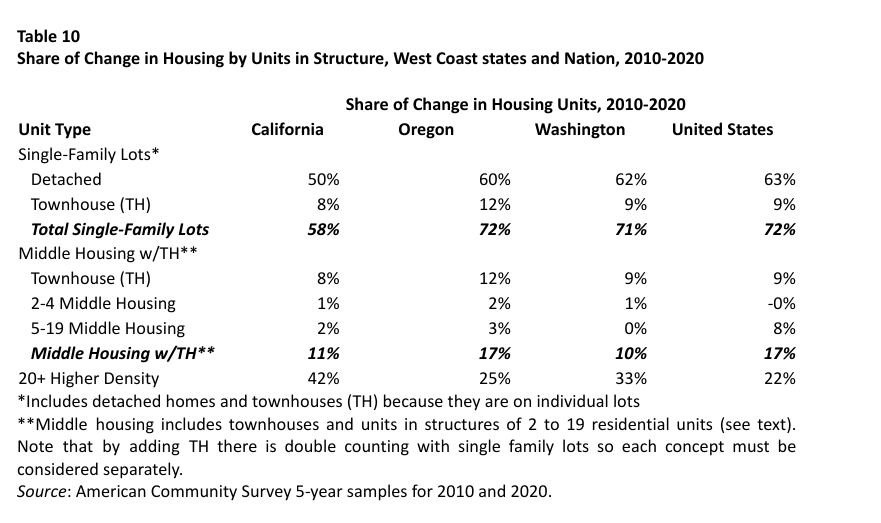
Between 2010 and 2020, a bit more than 70 percent of the change in homes in Oregon, Washington, and the nation were single family detached or townhouse units on individual lots. For California, the figure is a bit less than 60 percent. Among West Coast states, Oregon generated the largest share of townhouses and other “middle” homes, being 17 percent compared to 11 percent for California and 10 percent for Washington, while matching the nation. About a quarter of the change in homes were higher density for Oregon compared to a third for Washington and 42 percent for California, and slightly more than for the nation at 22 percent. Moreover, Oregon’s share of new “plex” housing leads its West Coast peers and the nation. These are the ingredients for walkable communities.
On balance, Oregon appears to have broadened housing choices compared to its West Coast peers. So much for Oregon stifling housing choices relative to demand as revealed by NAR market surveys.
There is another perspective I am compelled to share. The two most debilitating eras for financial institutions since the Great Depression were the “savings-and-loan bailout” of the late 1980s and the Great Recession of the late 2000s. Both instances involved American taxpayers bailing out financial institutions that were over-extended because they lent more money to developers and home buyers than the market could support. Over those financial shocks, Oregon fared best among the states in matching development permitting with market demand. (29) What was its reward for responsible behavior? Oregon taxpayers subsidized losses incurred by other states for allowing more development that their markets could sustain. In a sense, Oregon is entitled to a national IOU for being responsible in how it matches development permitting with market demand thereby preventing losses that would need taxpayer bailouts.
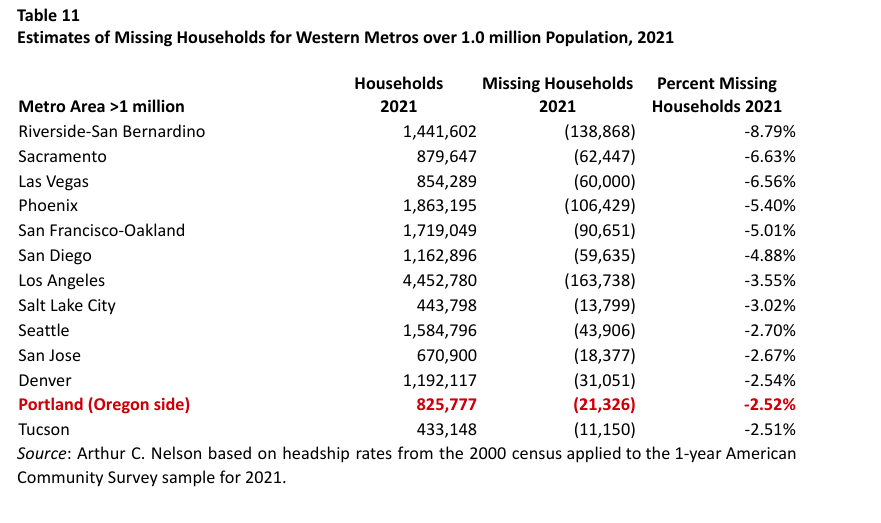
A final assessment addresses the extent to which housing demand is met. One way in which to measure this is estimating the number of “missing households”. The census defines a household as everyone living in a housing unit. It glosses over people living in the same unit who want to live on their own, such as children back from college who can’t find or afford a place of their own, older persons in transition between life circumstances who can’t find a place of their own, and older persons who cannot move into more appropriate housing for lack of supply and thus share their homes with others (such as grandchildren). Using headship rates for the year 2000 for age groups of 15 to 34, 35 to 44, 45 to 54, 55 to 64, and 65 years of age and older, Table 11 shows my estimates of missing households for all western metropolitan areas of more than 1.0 million persons. The Oregon side of the Portland metropolitan area has the second smallest percent of missing households (behind Tucson) suggesting on balance that it does a better job of meeting housing needs than nearly all such metropolitan areas. (30)
Future Research
Considering that the first four states reviewed above embarked on significant policy changes to advance housing choice and increase housing supply at about the same time, researchers may be able to tease out differential outcomes associated with each state approach by about the end of the 2020s. I may be alone in doing so with respect to Oregon’s policies over the longer term, but more research can be done here as well, especially with respect to policies adopted since 2019.
About the Series Author
Arthur C. Nelson, Ph.D., FAICP, is Professor Emeritus of Urban Planning and Real Estate Development at the University of Arizona where he designed an online Master of Real Estate Development program that has become the nation’s top-rated and most diverse graduate real estate degree opportunity. He is also Presidential Professor Emeritus of City & Metropolitan Planning at the University of Utah where he was founding director of the Metropolitan Research Center and the Master of Real Estate Development Program, as well as founder of the doctoral program in Metropolitan Planning, Policy, and Design. Nelson is from Oregon and has engaged in professional practice or research in all the conterminous western states. He is the author of more than 20 books, more than 400 other publications, and has been a principal investigator or Co-PI of more than $50 million in grants and contracts.
FOOTNOTES
Garson O’Toole, “May You Live in Interesting Times”, Quote Investigator: Exploring the Origins of Quotations. Accessed October 15, 2023.
See Housing Supply: A Growing Deficit available at https://www.freddiemac.com/research/insight/20210507-housing-supply and Housing Underproduction 2023 available at https://upforgrowth.org/apply-the-vision/2023-housing-underproduction/.
See Addressing America's Affordable Housing Crisis summary available at https://housingmatters.urban.org/research-summary/addressing-americas-affordable-housing-crisis and full report, The Gap: A Shortage of Affordable Rental Homes, available at https://nlihc.org/gap.
In disclosure, I serve on its research advisory board.
See https://upforgrowth.org/apply-the-vision/2023-housing-underproduction/ for calculation details.
From 169 to 193 of 256 metropolitan areas studied. https://upforgrowth.org/apply-the-vision/2023-housing-underproduction/.
The headship rate is calculated as the number of householders within each age cohort divided by the number of persons also within each age cohort, times the number of persons within each age cohort.
The 2021 ACS is that same data used in Up for Growth’s 2023 report at https://upforgrowth.org/apply-the-vision/2023-housing-underproduction/.
Why the name “Dillon”? Dillon's Rule comes from a decision made by Iowa Judge John F. Dillon in City of Clinton v. Cedar Rapids & Missouri River Railroad 24 Iowa 455 (1868). In a famous statement, Judge Dillon ruled that because local governments are “creatures of the state,” legislatures are free to delegate or rescind powers unless otherwise conferred by state constitutions.
See Jesse Richardson, Jr., Meghan Zimmerman Gough, and Robert Puentes, Is Home Rule the Answer? Clarifying the Influence of Dillon's Rule on Growth Management, Brookings Institution (2003).
For an example of how Oregon addresses these types of decisions, see https://www.oregonlandusetraining.info/data/pages/4_text.html.
The genesis of this in planning is through Village of Euclid v. Ambler Realty Co., “If the validity of the legislative classification for zoning purposes be fairly debatable, the legislative judgment must be allowed to control.” 272 U.S. 365, 388 (1926).
In disclosure, I was part of several teams engaged in CEQ assessments during the late 1970s and early 1980s before my academic career.
I am being overly general about how CEQA was intended to work and how it morphed into what it is today. For background and perspectives, see William Fulton, Guide to California Planning, 6th Edition, Solano Press Books (2022). For legal details, see Albert I. Herson and Gary A. Lucks, California Environmental Law & Policy, 2nd Edition, Solano Press Books (2017).
A key feature of impact assessment is that the proponent, usually a developer, would be required to pay the cost of assessment while the local government selected the team that would actually do the work.
From https://en.wikipedia.org/wiki/California_Environmental_Quality_Act#Criticisms.
For a detailed review, see Bill Fulton, David Garcia, Ben Metcalf, Carolina Reid, and Truman Braslaw (2023). New Pathways to Encourage Housing Production: A Review of California’s Recent Housing Legislation. Berkeley CA: University of California, Berkeley, Terner Center for Housing Innovation. Much of the details of California’s innovations reviewed in this article is adapted from Fulton et al.
Metcalf, B., et al. (2021). Will Allowing Duplexes and Lot Splits on Parcels Zoned for Single-Family Create New Homes?” Terner Center for Housing Innovation at UC Berkeley. Retrieved from: https://ternercenter.berkeley.edu/wp-content/uploads/2021/07/SB-9-Brief-July-2021-Final.pdf.
Much of this review is adapted from Catie Gould’s analysis accessed in https://www.sightline.org/2023/05/09/montanas-big-bipartisan-housing-deal/.
Much of this discussion is adapted from https://coloradoaffordablehousingfinancingfund.com/.
For details about the program, see Megan Horst, ed., Toward Oregon 2050, Oregon State University Press (2024).
For a detailed review of the rationale, political economy, and structure of the formative years, see Gerrit-Jan Knaap and Arthur C. Nelson, The Regulated Landscape, Lincoln Institute of Land Policy (1992).
For brevity in not using extensive space to identify and respond, I have decided not to name names but would invite readers to review libertarian views of Oregon’s planning program.
Jesse M. Abraham, William N. Goetzmann, and Susan M. Wachter. 1994. Homogeneous Groupings of Metropolitan Housing Markets. Journal of Housing Economics, 3(3): 186-206.
I was privileged to have served as a special advisor to Susan M. Wachter when she was Assistant Secretary for Policy Development and Research at the U.S. Department of Housing and Urban Development in 2000. Together we helped pioneer the housing-plus-transportation cost concept of measuring housing affordability, exploring new frameworks for regional governance, and the New Markets tax credit program among others. She gave me special license to develop many new research ideas that I have pursued in the decades since.
Nelson, Arthur C. 1992. Preserving Prime Farmland in the Face of Urbanization. Journal of the
American Planning Association. 58(4): 467-488.
See: Arthur C. Nelson (2006), Leadership in a New Era. Journal of the American Planning Association. 72(4): 393-409; Arthur C. Nelson (2013), Reshaping Metropolitan America: Trends and Opportunities to 2030. Washington, DC: Island Press; and Daniel Parolek with Arthur C. Nelson (2020), Missing Middle Housing: Thinking Big and Building Small to Respond to Today’s Housing Crisis. Washington, DC: Island Press.
See results for the 2023 survey at https://www.nar.realtor/reports/nar-community-and-transportation-preferences-surveys.
See Arthur C. Nelson, John Travis Marshall, Julian Conrad Juergensmeyer, and James C. Nicholas (2017). Market Demand Based Planning and Permitting. Chicago, IL: American Bar Association.
The Washington side of the Portland-Vancouver-Hillsboro metropolitan area had a missing household rate of 5.3% in 2021.